Temperature trends since 1900 in and around Belfast
Using data from the European Centre for Medium-Range Weather Forecasts, we analysed 118 years of weather data in and around the city of Belfast. The area analysed also includes the surroundings of Belfast, which might include mountains or bodies of water, so that the temperatures shown here do not correspond exactly to the temperatures recorded by the weather stations of Belfast (see Methodology for details). This is what we found:
 The temperature in and around Belfast between 2000 and 2018 was 0.3°C above the 20th century average.
 The number of hot days (above 18°C over a 24-hour average) went from 2.1 days per year in the 20th century to 3.1 per year in the years since 2000.
Changes in weather patterns
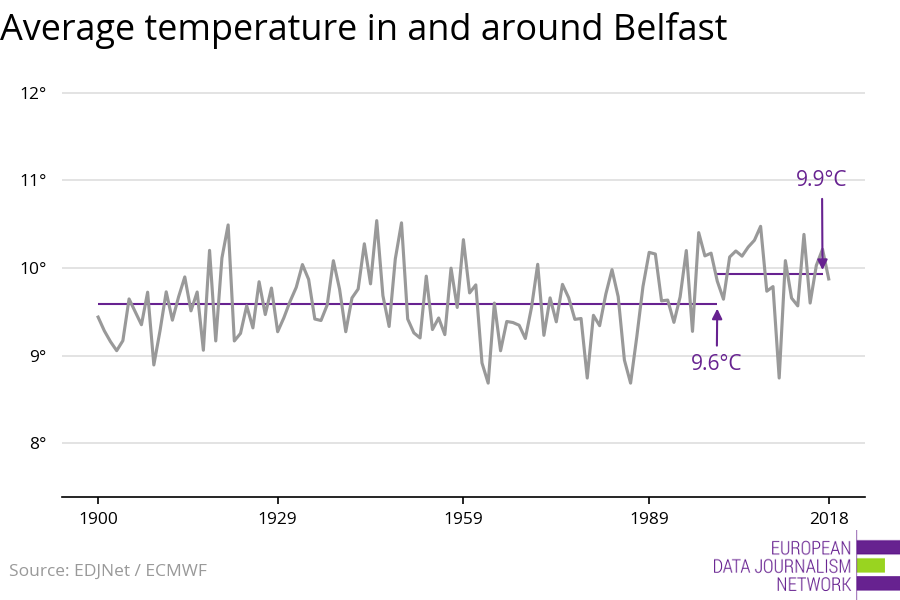
Temperature changes
Since 1900, the average temperature in and around Belfast increased from an average of 9.6°C between 1900 and 1999 to an average of 9.9°C between 2000 and 2018. The warmest years in and around Belfast were 1945, 1949, 1921, 2007, and 1997.

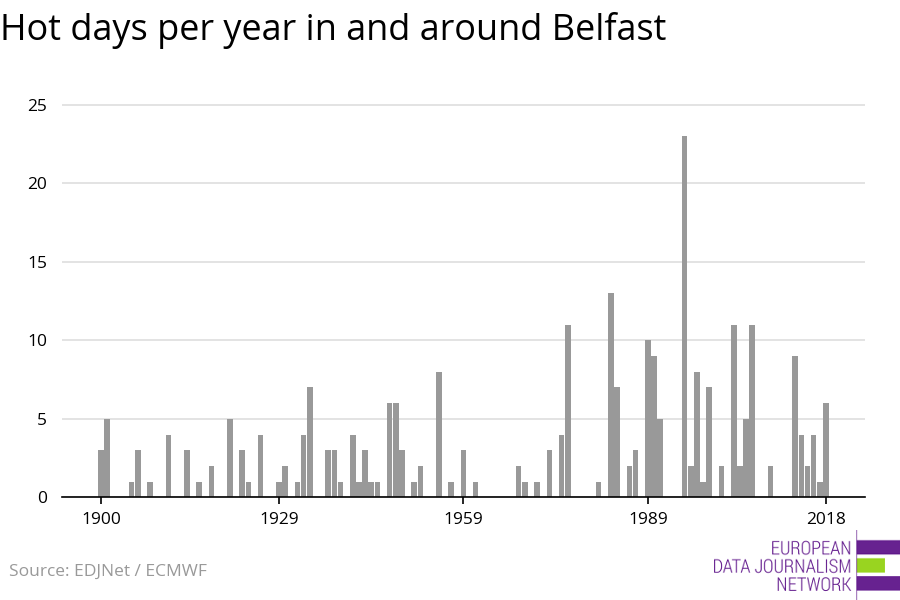
Hot days
In the 20th century, the average number of hot days (days for which the 24-hour average temperature is above 18°C) per year was 2.1. Between 2000 and 2018, the average number of hot days were 3.1 per year.
A day is considered hot when its average temperature is over two standard deviations of the normal average.

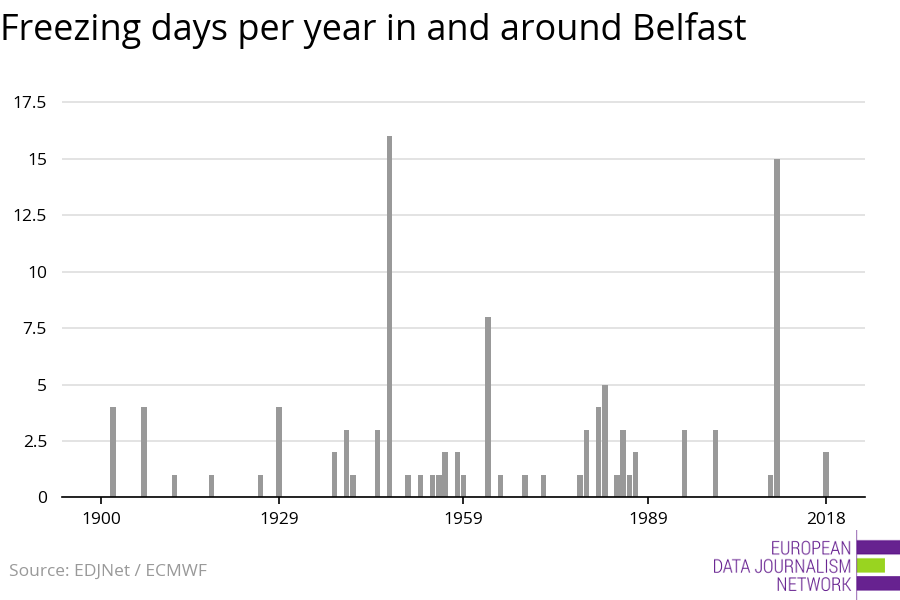
Freezing days
Temperature averaged −1°C or less for 0.8 days per year in the 20th century, on average. Between 2000 and 2018, the number of freezing days were 1.1 per year.This makes Belfast and its environs one of the few locations where the number of freezing days has increased.

What does it mean for Belfast?
Health and heat waves
Higher temperatures lead to excess mortality, even in relatively cold countries. A study of nine European cities, including Stockholm and Helsinki, showed that heat-related deaths increase as soon as average daily temperatures reach 20°C (de’Donato, 2005).
Rising temperatures may also cause the number of deaths related to extremely cold weather to drop.
Rail buckling and tarmac softening
In high temperatures, asphalt exposed to the sun starts to soften. This causes delays and some roads have to be closed to traffic.
When temperatures rise above 30°C, rails exposed to the sun can move or buckle. This can cause trains to derail, as happened many times in Europe already, and forces them to run more slowly, causing major delays.
Tick and mosquito-borne diseases
Tick-borne encephalitis, and more recently ehrlichiosis have been spreading in the past decades, probably due to higher temperatures (Gray et al., 2009).
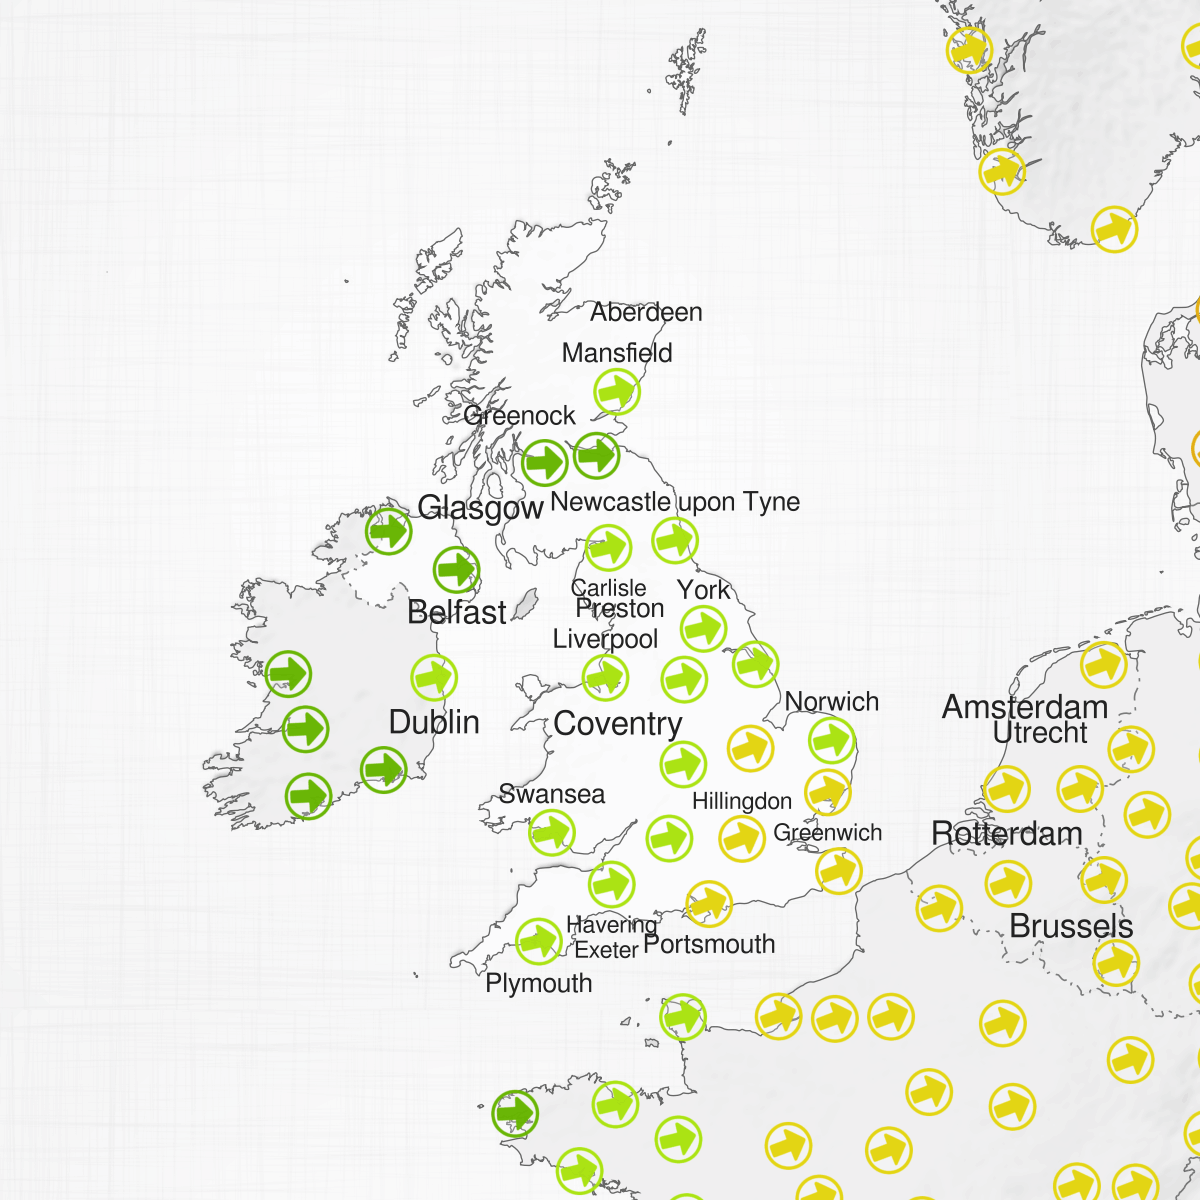
Belfast and its environs in context
Belfast and nearby cities
Here are the five locations closest to Belfast, among the 558 we analyzed:
| Location | Distance | Temperature change |
|---|---|---|
| Belfast | — | +0.3 |
| Derry City and Strabane | 99 km | +0.3 |
| Dublin | 140 km | +0.4 |
| Greenock | 167 km | +0.4 |
| Glasgow | 176 km | +0.4 |
| Airdrie | 188 km | +0.4 |
Cities of United Kingdom
Belfast is one of 44 locations in United Kingdom we have analyzed. This is how temperature has changed in the rest of them.
| Location | Temperature change |
|---|---|
| Greenwich | +0.9 |
| London Borough of Tower Hamlets | +0.9 |
| Medway | +0.8 |
| Maidstone | +0.8 |
| Croydon | +0.8 |
| London | +0.8 |
| Hillingdon | +0.8 |
| Portsmouth | +0.8 |
| Peterborough | +0.8 |
| Northampton | +0.8 |
| Birmingham | +0.8 |
| Coventry | +0.8 |
| North East Lincolnshire | +0.8 |
| Kingston upon Hull | +0.8 |
| Norwich | +0.8 |
| Lincoln | +0.7 |
| Swindon | +0.7 |
| York | +0.7 |
| Southampton | +0.7 |
| Liverpool | +0.7 |
| Preston | +0.7 |
| Blackburn with Darwen | +0.7 |
| Manchester | +0.7 |
| Newcastle upon Tyne | +0.6 |
| Havering | +0.6 |
| Bath and North East Somerset | +0.6 |
| Bristol | +0.6 |
| Swansea | +0.6 |
| Sheffield | +0.6 |
| Leeds | +0.6 |
| Plymouth | +0.6 |
| Cardiff | +0.6 |
| Torbay | +0.5 |
| Exeter | +0.5 |
| Mansfield | +0.5 |
| Aberdeen | +0.5 |
| Carlisle | +0.5 |
| Edinburgh | +0.4 |
| Glasgow | +0.4 |
| Airdrie | +0.4 |
| Falkirk | +0.4 |
| Greenock | +0.4 |
| Belfast | +0.3 |
| Derry City and Strabane | +0.3 |
Methodology
We analyzed two data sets from the European Centre for Medium-Range Weather Forecasts (ECMWF), ERA-20C for the period 1900–1979 and ERA-interim for the period 1979–2018.
Both data sets are re-analysis, which means that ECMWF scientists used observations from a variety of sources (satellite, weather stations, buoys, weather balloons) to estimate a series of variables for squares of about 80 kilometers in side width (125 kilometers for ERA-20C). While weather stations offer a much better record for immediate daily observations, using the ECMWF re-analyses is much more adequate for the study of long-term trends. Weather stations might move, or the city might expand around them, making their data unreliable when looking at centennial trends. However, the ECMWF data does not take into account micro-climates or “heat island” effects, so that the actual weather in the streets of Belfast was probably one or two degrees warmer than the values reported here (the trend, however, is the same).
Since the start of this project, ECMWF has adjusted the way historical temperatures are calculated, to give better estimates for e.g. coastal cities. Because of this, some figures published here in 2019 may differ slightly from corresponding figures published in 2018.
This report was produced by the European Data Journalism Network. Partners include OBC Transeuropa (Italy), J++ (Sweden), Spiegel Online (Germany), Vox Europe (France), Pod Crto (Slovenia), Mobile Reporter (Belgium), Rue89 (France), Alternatives Economiques (France), and El Confidencial (Spain).
References
de’Donato, Francesca K., et al. "Changes in the effect of heat on mortality in the last 20 years in nine European cities. Results from the PHASE project." International journal of environmental research and public health 12.12 (2015): 15567-15583.
Dee, D. P., Uppala, S. M., Simmons, A. J., Berrisford, P., Poli, P., Kobayashi, S., Andrae, U., Balmaseda, M. A., Balsamo, G., Bauer, P., Bechtold, P., Beljaars, A. C. M., van de Berg, L., Bidlot, J., Bormann, N., Delsol, C., Dragani, R., Fuentes, M., Geer, A. J., Haimberger, L., Healy, S. B., Hersbach, H., Hólm, E. V., Isaksen, L., Kållberg, P., Köhler, M., Matricardi, M., McNally, A. P., Monge-Sanz, B. M., Morcrette, J.-J., Park, B.-K., Peubey, C., de Rosnay, P., Tavolato, C., Thépaut, J.-N. and Vitart, F. (2011), The ERA-Interim reanalysis: configuration and performance of the data assimilation system. Q.J.R. Meteorol. Soc., 137: 553–597. doi: 10.1002/qj.828
Graff Zivin, Joshua, Solomon M. Hsiang, and Matthew Neidell. "Temperature and Human Capital in the Short and Long Run." Journal of the Association of Environmental and Resource Economists 5.1 (2018): 77-105.
Gray, J. S., et al. "Effects of climate change on ticks and tick-borne diseases in Europe." Interdisciplinary perspectives on infectious diseases (2009).
Laloyaux, P., Balmaseda, M., Dee, D., Mogensen, K. and Janssen, P. (2016), A coupled data assimilation system for climate reanalysis. Q.J.R. Meteorol. Soc., 142: 65-78. doi:10.1002/qj.2629
Larsen, Janet. "Plan B Updates", Earth Policy Institute, 28 July 2006.
Michailidou, Alexandra V., Christos Vlachokostas, and Νicolas Moussiopoulos. "Interactions between climate change and the tourism sector: Multiple-criteria decision analysis to assess mitigation and adaptation options in tourism areas." Tourism Management 55 (2016): 1-12.
Scott, D., and Chr Lemieux. "Weather and climate information for tourism." Procedia Environmental Sciences 1 (2010): 146-183.
Zeller, H., et al. "Mosquito‐borne disease surveillance by the European Centre for Disease Prevention and Control." Clinical microbiology and infection 19.8 (2013): 693-698.